
2025 APIA Community Survey


Shubhecchha Dhaurali
Program & Research Director
Shubhecchha Dhaurali (she/her) brings 5+ years of experience in community-centered research, program development, and strategic leadership across nonprofit, academic, and public sectors. In her role at the AAPI Commission of Massachusetts, she leads statewide initiatives focused on data disaggregation, community engagement, and advocacy for AAPI communities. Her work is grounded in a commitment to equity, and she is especially interested in how research can be made more accessible and actionable for those most impacted by systemic injustice.
Shubhecchha holds a B.A. in Community Health from Tufts University, where she graduated summa cum laude. Her research background spans both qualitative and quantitative methods, with published work in peer-reviewed journals and collaborative community reports. She is also deeply passionate about mentoring, storytelling, and using data as a tool for social change.
Outside of work, Shubhecchha enjoys reading novels, writing short stories, and spending time with her family and two puppies.
Saatvik Ahluwalia
Chairperson
Saatvik Ahluwalia is a father, husband, and community activist serving as Chair of the Massachusetts Asian American and Pacific Islander Commission. His work is grounded in a deep belief: that investing in our communities and amplifying the voices of those too often unheard is how lasting change begins.
A storyteller at heart, Saatvik has spent his career organizing, advocating, and building platforms for impact. He led award-winning voter turnout and Census outreach focused on AAPI communities, organized one of the first and largest Stop Asian Hate rallies, and founded Asian Texans for Justice—the first statewide AAPI advocacy organization in Texas. His leadership in this space earned him an invitation to the White House to speak on hate crime policy.
Saatvik is a Public Voices Fellow with The OpEd Project and a New Leaders Council Fellow. He’s also been recognized for his public speaking through Toastmasters International, competed in Bollywood dance championships, and was profiled in Those Immigrants!: Indians in America: A Psychological Exploration of Achievement by journalist Scott Haas.
At every stage, Saatvik’s commitment has remained the same: to create space, build power, and ensure that everyone—especially those left out of the conversation—has a chance to thrive.
Marilyn Park
Commissioner
Anne Lizette Sta. Maria
Communications Director
Anne Lizette Sta. Maria (she/her) uses communications to serve communities and causes.
As Communications Director, Lizette is responsible for developing and implementing comprehensive communication strategies that align with AAPIC’s three-year strategic plan. She oversees AAPIC’s digital presence, ensuring that the messaging is culturally responsive and accessible. Additionally, Lizette supports key initiatives such as the annual Unity Dinner celebration and the Community Engagement & Visibility Subcommittee, building relationships across communities, the media, and public platforms.
Lizette graduated summa cum laude from UMass Amherst, having studied Communication, Journalism, and Public Relations. She also co-founded the UMass Amherst Filipino Student Association. She then spent her post-grad gap year driving high-impact initiatives for various nonprofits and higher education institutions.
Lizette’s journey has been shaped by a commitment to bridging communities and empowering voices. She is honored to contribute to a vision of inclusive change and to champion greater equity and representation for AAPI residents of Massachusetts. In her free time, Lizette enjoys the health benefits of daily walks, herbal teas, and a regular gratitude practice.

Leela Ramachandran
Policy Director
Leela Ramachandran (she/her) comes to the AAPI Commission with 8+ years in advocacy, and most recently, 4 years in research and evaluation. She brings these skill sets to her current work, focusing on how policies can be data-driven and better serve those most impacted. With a background in anti-racism organizing and political campaigns, Leela was elected to the Acton-Boxborough Regional School Committee in 2023. She also serves on the community advisory boards of a Planned Parenthood study focused on young people’s access to reproductive care, Massachusetts Department of Public Health’s Public Health Data Warehouse, and GBH. Leela holds a B.S. in Public Health Sciences and a certificate in Civic Engagement and Public Service from the University of Massachusetts Amherst.
Outside of work, Leela can be found cooking with loved ones, exploring her relationships to identity and liberation, and reading. Reach out if you have ideas for collaboration or would like to connect!

Li Morrison
Commissioner
Li Morrison is the Director of Court and Housing Mediation at MetroWest Mediation Services, a nonprofit organization aiming to facilitate peaceful resolution of disputes within all communities by supporting people to work together to resolve conflict. Through her steadfast dedication and efforts in leading the Housing Mediation Program by providing mediation and other supportive services to both landlords and tenants, thousands of metro west residents avoided eviction and homelessness. As a result, Framingham District Court has the lowest eviction rate in the state since November 2020, compared with all other major district courts that have more than 200 eviction filings.
Additionally, Li oversees the mediation and conciliation services in the District Court, Juvenile Court, Probate and Family Court that MWMS serves. Prior to this role, Li worked as a volunteer mediator with MWI and MWMS for several years. Currently, she is also serving as a board member for Family Promise Metrowest, a nonprofit organization providing a continuum of programs to support families facing housing insecurity.
Immigrated from Shanghai, China over 30+ years ago, Li is passionate about helping people, particularly those who do not have a voice. Li earned a BS in Electrical Engineering, a MS in statistics and a JD. She is a licensed member of the California Bar Association.
Cha Lor
Western Massachusetts Regional Coordinator
Cha Lor (she/her) is a Hmong American community organizer with a strong background in event coordination, relationship building, and amplifying underrepresented voices. With extensive experience working with diverse communities, including LGBTQIA+ and Southeast Asian groups, she has organized inclusive events, secured funding, and managed social media campaigns to drive awareness and engagement. Passionate about social justice, she facilitates meaningful conversations that bring people together and empower marginalized communities.
Throughout her career, she has supported organizations like Public Arts Saint Paul, Springboard for the Arts, and Indigenous Roots, where she coordinated events, managed communications, and created inclusive spaces for diverse artists. As a Creative Director, she led efforts to preserve Hmong American culture, securing funding and fostering a vibrant Southeast Asian arts community. Fluent in intercultural communication, she is dedicated to creating spaces for open dialogue and building lasting relationships that drive social change.
Tuyet Tran
Commissioner
Tuyet Tran, LICSW, a refugee from Vietnam, holds a master’s degree in social work from Boston College and an undergraduate degree in psychology from Emmanuel College. She brings 30 years of progressive leadership in the design and delivery of public health and social services, including serving as Director of Integrated Care at Community Healthlink for 18 years during which she was recognized by the Worcester Business Journal as a 40 Under 40 “rising star” in the Worcester community. For the past 5 years, Ms. Tran led the Community Partner Program at the Behavioral Health Partners of Metrowest (BHPMW) where she helped to design a multiregional integrated care coordination program as part of the MA Executive Office of Health and Human Service’s DSRIP Demonstration Project.
Ms. Tran has lived in Worcester since June of 2000. At that time, she and a small group of community members came together to advocate for social and health care access for members of the Southeast Asian community. Ms. Tran served as SEACMA Board Chair and Acting Director for the first few years of its founding and continued to support the organization as a board member and supporter for many years after. She was instrumental in steering SEACMA from its inception into a viable community organization and has recently returned as Executive Director to once again lead the organization into the next chapter.
Gary Y. Chu
Commissioner
Dr. Gary Y. Chu is the Vice President of Professional Affairs at the New England College of Optometry. He received his Doctor of Optometry (OD) degree from the New England College of Optometry in 1995 and his Masters of Public Health (MPH) in 2002 from the Harvard T.H. Chan School of Public Health.
He has been in practice and optometric education for over twenty-five years and is involved in the changing landscape of eye care, health care and public health during this span of time. Dr. Chu has been in the forefront of eye care innovations through the development of collaborative partnerships with health systems, federally qualified health centers, social service agencies, local and state government, school systems, health payors, ophthalmic industry and optometry employer groups.
Dr. Chu has been involved in issues of diversity, equity, inclusion and belonging for over ten years and has served on the diversity and cultural competency committee for the Association of Schools and College of Optometry (ASCO) from 2011-2020. He is the founding chair of ASCO’s Diversity, Equity and Inclusion (DEI) SIG and was the Guest Editor for the Journal of Optometric Education’s theme issue on diversity and cultural competency in 2017. In 2021, he was presented the ASCO’s Dr. Jack Bennett Innovation in Optometric Education Award.
Gary Yu
Vice Chair
Gary Yu is a senior media personality and political activist. In 2016, he founded Boston International Media Consulting Inc. Four years later, he established Boston Asian Radio and TV, a station dedicated to the lives and interests of Asians. Gary Yu is a senior media personality. He also served as a producer and host of ATV, BNN TV, and Quincy Access Television (QATV), and a reporter for World Journal, World Journal Weekly, and other publications.
In addition, he contributed to the election campaigns of Boston Mayor Michele Wu and Massachusetts Governor Maura Healey. He is currently the President of New England Chinese American Alliance, Co-President of the
Massachusetts Chapter of United Chinese Americans, and President of the Boston Chapter of the Asian Pacific Islander American Public Affairs Association. He also is Transition Team Member of State Auditor Diana
Dizoglio and Suffolk County District Attorney Kevin Hayden. In February 2023, He brought the community together to promote for unanimous approval Resolution in support of designating Lunar New Year as an official holiday in the City of Boston by the Boston City Council. In May 2023, He brought the community together to promote for the Governor of Massachusetts to sign the Proclamation designating May as AAPI Heritage Month in Massachusetts.
Bahara Hussaini
Commissioner
Bahara grew up in Kabul Afghanistan and moved to the United States in 2021 to pursue her master’s degree in Peace and Conflict Studies from the University of Massachusetts Lowell through Fulbright Scholarship. She also holds a bachelor’s degree in Political Science and Public Administration from the American University of Afghanistan. A distinguished academic and a passionate advocate for education and peace, Bahara has dedicated her career to fostering understanding and empowerment in her community.
In 2019, she founded The Bookies Movement, a volunteer-driven initiative that promotes peace and acceptance among Afghan children. This impactful program has actively worked to cultivate a culture of harmony and mutual respect across five provinces in Afghanistan.
Currently, Bahara serves as the Bilingual Liaison Lead at the Equity and Empowerment Office of Lowell Public Schools, where she plays a pivotal role in advancing educational equity and promoting inclusivity. In addition, she is leading the Afghan Women Empowerment Program at the ACE Center for New Americans, focusing on empowering Afghan women and fostering their active participation within the community.
Previously, she worked as a Project Manager for Afghans for Progressive Thinking, where she led a peace-building project across six provinces in Afghanistan, engaging Afghan youth to create a lasting impact.
Bahara is deeply committed to education, peace-building, gender equality, and human rights. She continues to dedicate her efforts to serving the Afghan community and other (APPI) communities across the Commonwealth.

Ying Kay Leung
Youth Council Member
My name is Ying Kay Leung, I’m 16 years old. I am a Western Massachusetts native residing in Belchertown. I’m passionate about photography, writing, skiing, and diverse advocating for diverse AAPI communities. I’m excited to meet and talk to you all!

William Nguyen
Youth Council Member
William Nguyen (he/him) is a rising senior at North Quincy High School hoping to pursue a career in public health and medicine. Inspired by his parents’ experiences as Vietnamese immigrants, he gained a strong appreciation of his background and support for his communities. As a resident of Quincy, he has became involved in the local communities to help support and empower youths to develop their leadership skills and apply these skills when serving and investing in their communities. William hopes to advocate and uplift the voices of AAPI youth while working alongside a team of like-minded individuals on the Youth Council. During his free time, he enjoys listening to music, cooking, and spending time with loved ones.

Aden Huang
Youth Council Member
Aden Huang is a senior at Winchester High School and is excited to get involved through the AAPI Youth Council! He helped found Winchester’s annual AAPI Festival and Multicultural Night to highlight the diversity of the community. Outside of school, Aden is involved in student council, Model UN, and track & field. He also enjoys watching movies and traveling!

Mirei Saneyoshi
Youth Council Member
Mirei Saneyoshi (she/her) is a senior at Lexington High School interested in pursuing political science and ethnic studies. Drawing on her experiences as a second generation Japanese and Chinese American, Mirei is passionate about racial equity and inclusion within the legal system. Mirei currently works with the Systemic Justice Project, Coalition for Anti-Racism and Equity, and the Chinese American Association of Lexington on a variety of initiatives promoting social justice. In her free time, Mirei enjoys competing at debate tournaments, running, and spending time with friends.

Lindell Valsote
Youth Council Member
My name is Lindell Dre Bantayan Valsote, a Filipino American high school senior, born and raised in Salem Massachusetts. I have a deep appreciation for my Filipino culture, which I explore through its food, music, media, and even through creating a Filipino Culture Club at my school. I have actively taken roles in my school’s student government, and cross country and track and field teams. In my free time I enjoy playing piano, reading comics, speed cubing, and playing Minecraft with my friends. Looking ahead, I am hoping to blend my cultural experiences, and academic pursuits to contribute to positive change in our community.

Julie Hong
Youth Council Member
Julie (any pronouns) is a rising senior from Wellesley High School, Massachusetts. As a second-generation, non-binary Chinese American, they’re passionate about youth advocacy for the AAPI community in the area of public health and its intersection with development studies. They’re a member of the UCA Youth Leadership Council and lead The BOBA Project Youth Advisory Board’s study design committee to best address the needs of Chinese American youth and amplify their perspectives for cultural change through discussion about identity. In their free time, they create art, bake, and draw inspiration from the haute couture world.

Gina Yi
Youth Council Member
Gina Yi (she/her) is a senior at Plymouth North High School. As a first-generation Korean American, Gina is passionate about ensuring a diverse and inclusive environment while raising cultural awareness in her community. She strives to implement such initiatives through participation in several organizations, such as Dear Asian Youth, and cultural clubs within her school. She hopes to continue to do so during her time as a member of the Youth Council. In her free time, Gina enjoys reading, learning new instruments, and traveling.

Elianna Umana Kimura
Youth Council Member
I’m a rising senior from Westfield Massachusetts of Japanese and Hispanic descent. I am part of Maura’s Healey’s youth council where I represent Hampden county and continue my interests in Government and leadership. I have interests in the sciences, writing and the outdoors. I play competitive soccer, alpine skiing as well as track. In my free time I work as a nurses aid, bake, as well as volunteer at my local nursing home and soup kitchen.

Chahat Kalia
Youth Council Member
Hello! My name’s Chahat and I’m a passionate advocate for AAPI rights, LGBTQIA+ rights, climate justice, and mental health awareness, with a strong focus on supporting marginalized communities. I’m actively engaged in educational initiatives and campaigns to promote awareness and inclusivity, particularly within schools and local communities. My dedication to these causes is reflected in my advocacy work within my state and city where I aim to create a more equitable and understanding society. I hope to bring a unique perspective to on going activism efforts from my unique experiences and perspectives as a young individual of Asian descent navigation navigating cultural and societal challenges.

Aidan Le
Youth Council Member
My name is Aidan Le and I am Vietnamese-American. I am from Worcester, MA and I will be a senior in high school for the 24-25 school year. Some of my passions include gardening, sports, and reading. I am very grateful to have been put in a position where I may have an impact on our AAPI communities and intend to use my creativity and insight to create positive change and see AAPI culture celebrated and appreciated by society.
Aden Huang
Youth Council Member
Aden Huang is a senior at Winchester High School and is excited to get involved through the AAPI Youth Council! He helped found Winchester’s annual AAPI Festival and Multicultural Night to highlight the diversity of the community. Outside of school, Aden is involved in student council, Model UN, and track & field. He also enjoys watching movies and traveling!
Aidan Le
Youth Council Member
My name is Aidan Le and I am Vietnamese-American. I am from Worcester, MA and I will be a senior in high school for the 24-25 school year. Some of my passions include gardening, sports, and reading. I am very grateful to have been put in a position where I may have an impact on our AAPI communities and intend to use my creativity and insight to create positive change and see AAPI culture celebrated and appreciated by society.
Monita Seng
Communications Coordinator
Monita Seng (she/her) is a senior at Boston University pursuing a Bachelors of Science in Advertising at the College of Communication. She brings her perspective as a first-generation college student, a Cambodian-American, and a lifelong community builder to her role as the Communications Coordinator for the AAPIC. Her time as the Co-Media Public Relations Chair for the University of Massachusetts Amherst Asian American Student Association fostered her passion for cultivating inclusive environments and innovative social media. In her role as the Public Relations Career Ambassador Team Captain for Boston University’s Center for Career Development, she extends her love for personal and professional development, offering guidance to her peers as they navigate their career paths. Seng’s ambition to innovate within the advertising industry also led her to AdLab, the largest student-led advertising agency in the country, where she serves as the Vice President of Project Management overseeing 15 client teams. Seng is excited to employ innovative communication strategies to promote the AAPIC’s mission of advocacy for the AAPI Community. In her free time, find her on the hunt for good coffee and matcha, exploring Boston, or humming Broadway tunes.
Karen Chen
Commissioner
Karen Chen is Executive Director of Chinese Progressive Association (CPA). CPA is a grassroots community-based organization that works for full equality and empowerment of the Chinese community in the greater Boston area and beyond. Karen’s training began as a 10 year-old when she immigrated to the US and became de facto interpreter and advocate for her immigrant working class family, later honing her leadership and organizing skills as a youth intern with Coalition of Asian and Pacific American Youth and the Chinese Youth Initiative, a paralegal at Greater Boston Legal Services’ Asian Outreach Unit, and Tenant Service Coordinator at the Castle Square Apartments in the South End.
Karen has been involved in many campaigns that’s integral to CPA’s work. Together with workers, she helped dislocated Power-One electronic manufacturing workers win $1Million retraining fund followed by improved unemployed benefits for other electronic manufacturing workers, anti-wage theft protections for immigrant workers, and helped unionize the first privately owned home care agency in Massachusetts in 2015. Together with tenants, she helped numerous families to fight for their right to remain, bring stronger tenant protections, residents’ voice in land use and development, and policies such as Condo conversion protections for Boston residents, short-term rental regulation in Boston and in MA, and increased affordable housing requirements and linkage fund in Boston’s Inclusionary Development Policy. Together with Chinese speaking voters, she helped win fully bilingual ballots for Chinese voters in Boston and Malden.
Currently, the focus of CPA’s work is to ensure economic justice for Chinese Amreicans in the Greater Boston Area, stabilize Chinatown’s future, keep families in their homes, preserve affordable housing and Chinatown’s historical character, increase community control and ownership of land, community climate resilience, access to good jobs and improve labor standards of workers in our community.
Karen also served on several boards, including Massachusetts Community Labor United (CLU), Asian Pacific American Labor Alliance (APALA), the Massachusetts AFL-CIO, and the Asian Pacific Islanders Civic Action Network (APIs CAN!).
HARRIS ZHAO
Harris Zhao is an R&D Engineer turned Social Impact Executive working on several Non-Profits while serving as the Chief of Strategy for Get Konnected! – a Multicultural Connection Accelerator and the President of the National Association of Asian American Professionals. Harris is also the queer son of Chinese Immigrants and is the founder of PrideTalks a podcast for AAPI Queer Professionals and the Future Pride Leader Scholarship which is given to a rising undergraduate students identifying as LGBTQ+.
Harris has been invited as a guest speaker at Takeda, EY, BPDA, and other organizations covering the AAPI experience, Cultural Awareness training, and Diversity Consulting. He is an active trainer and leadership coach for rising multicultural community leaders in Boston including Asian-Affinity Employee Resource Groups, Youth groups such as CARE and Minds Matter, and has trained over 50 direct reports.
Harris was named one of NAAAP’s Outstanding Leaders in the nation and one of Boston’s Most Influential People of Color for the work he does in raising the bar for multicultural communities. He is also a PMP-certified Project Manager having led the Project Management Office at Takeda’s Preclinical Sciences organization and is a trained Chemical Engineer with a B.S. from UMass Amherst.
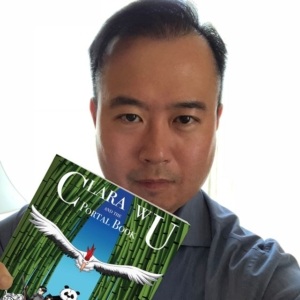
VINCENT YEE
Vincent Yee is the author and creator of “Clara Wu and the World of Azen.” Written during the pandemic with the rise of anti-Asian Hate, he wanted to write a fantasy series to uplift Asian American readers, especially young ones, where they could see themselves as superheroes! Book one in this immersive 5-book series, was a fantasy award winner at The 2022 Bookfest and it was featured on the Kelly Clarkson Show. Before parting ways with corporate America where he was a corporate manager for several Greater
Boston based companies, he was a past NAAAP National President and led many of the ERGs at the companies where he worked at. A Boston native, he grew up in Brookline and graduated from Suffolk University. When he’s not visiting schools or companies to excite people’s imagination of Asian American superheroes, he may be exploring his next culinary adventure or binging a K-Drama on Netflix.
CHAREEDA RUSTANAVIBUL
Chareeda Rustanavibul is a startup enthusiast, community builder, and nonprofit executive. She is Vice President at Silicon Valley Bank and manages pre-series A early-stage tech founders and startups across New England. She has built a strong community of early-stage founders, connecting them with venture capitalists and investors to provide more access to capital to grow their businesses. Outside of SVB, Chareeda is also the Vice President of Strategic Partnerships at a 501(c)(3) nonprofit, the National Association of Asian American Professionals (NAAAP), focused on community building and advancing Asian and Pacific Islander representation in executive leadership. She was the 2023 Chief Convention Director and led a national team of 100+ volunteers to deliver Boston’s largest leadership convention of Asian and Pacific Islander professionals. She led the organization’s highest-sponsored convention in 40 years and won the 2022 NAAAP Boston award for the most transformative leader.
She also manages a community of the top 500+ Asian and Pacific Islander founders at another nonprofit called Gold House. In 2023, the Greater Boston Chamber of Commerce named Chareeda a Top Ten Outstanding Young Leader.
RAMAKRISHNA PENUMARTHY
Ramakrishna Penumarthy epitomizes the values of dedication, compassion, and service, which are deeply ingrained in both his personal and professional life. Born and raised with a strong sense of community responsibility, Ramakrishna has dedicated himself to improving the lives of seniors and contributing to various community organizations.
Ramakrishna, the esteemed founder of Volunteering for Seniors, showcases unwavering dedication not only to the welfare of seniors but also actively engages in uplifting the community through his involvement in esteemed organizations like Lions Club, TAGB (Telugu Association of Greater Boston) and Team Aid. His commitment extends beyond senior care, readily stepping in to support the local community whenever needed.
Ramakrishna’s partnership with his wife, Pratima Penumarthy, in founding a volunteering organization focused on senior citizens underscores their shared commitment to making a difference. Together, they have established a thriving community that not only provides practical assistance but also fosters a sense of belonging and happiness among seniors. Their dedication to ensuring seniors lead fulfilling lives is reflected in the diverse range of activities and support services offered by their organization.
Through his selfless actions and tireless efforts, Ramakrishna has touched the lives of countless individuals, fostering a sense of belonging, happiness, and hope. His collaborative spirit, exemplified by his partnership with his wife in founding a volunteering organization for seniors, underscores the power of collective action in creating positive change.
MOHAN NANNAPANENI
The Co-Founder and CTO of Sigma Systems Inc., is a remarkable entrepreneur and philanthropist with a profound commitment to both the Indian and American communities. He has achieved extraordinary success in the business world, leading Sigma Systems Inc. to become one of the fastest-growing privately held companies in America. However, Mr. Nannapaneni’s impact extends far beyond the business realm.
In the realm of philanthropy, Mohan Nannapaneni has left an indelible mark. His contributions have led to the rebuilding of government schools in India, transforming them into thriving educational institutions. He has provided financial support to numerous students, enabling them to pursue higher education in medical and engineering colleges, including the prestigious IITs. ( www.nmfriends.org ) One of his notable contributions is the establishment of TEAM Aid, (www.teamaid.org) a nonprofit organization that focuses on providing assistance to individuals and families affected by catastrophic incidents such as accidents and sudden deaths. TEAM Aid has emerged as a vital resource, coordinating the transportation of deceased individuals to their respective hometowns across India and 15 other countries. It has become a leading emergency assistance provider within the immigrant community throughout North America. His advocacy skills came to the forefront when he intervened on behalf of over 2,400 students facing deportation when Tri-Valley University was closed, securing their readmission opportunities and protecting their dreams.
In addition to its role in helping families cope with the sudden loss of their loved ones, TEAM Aid, under Mohan Nannapaneni’s leadership, has also extended its support to individuals facing legal issues, especially those dealing with mental health challenges. This organization has rapidly expanded its reach, with more than 2,500 dedicated volunteers across North America and over 20 countries. On average, TEAM Aid now provides assistance to at least a dozen families per week in the USA, demonstrating its commitment to helping those in distress.
Mohan Nannapaneni’s community service efforts have touched the lives of countless individuals and families affected by disasters and emergencies, making TEAM Aid an indispensable resource in times of crisis. His dedication to community service and humanitarian work has earned him numerous service awards and recognitions from teachers’ unions, educational/cultural organizations, city councils, and NGO entities in both India and America. Through his unwavering commitment to TEAM Aid and other charitable causes, Mr. Nannapaneni continues to make a positive and lasting impact on communities worldwide.
SEA KAY LEUNG
Sea Kay Leung, a first-year student at Hamilton College from Belchertown, Massachusetts, encountered discrimination but also found community support, driving her involvement in Asian American advocacy. Joining the inaugural Massachusetts AAPI Youth Council heightened Sea Kay’s awareness and confidence as an Asian American advocate. She actively represents young Asian Americans, organizing events, advocating for crucial issues, and fostering dialogue within the community,
collaborating with cities like Amherst, Springfield, and Boston. Sea Kay’s advocacy extends to discussions with state and national members of Congress, addressing the diverse economic and cultural differences within Asian American communities. Notably, she co-founded the Asian American club in her high school, which has grown significantly to over 30 members and focuses on advocating social tolerance and acceptance. Their collaboration with the town of Amherst led to the proclamation of May as Asian American & Pacific Islander Heritage Month in 2023, celebrating Asian Americans as integral to American culture. Sea Kay’s commitment transcends geographical boundaries, as she participates in events like marches in Washington, D.C., and advocates for an Asian American Museum. Additionally, she supports social justice for other marginalized communities, contributing to uncovering systemic issues and earning national recognition for their advocacy. Through her dedication, Sea Kay Leung inspires others to pursue justice and equality.
Born in Chinatown in 1954, he is among the last generation of community activists with roots in the community and the Boston Public Schools. His activism includes civic, athletic, social, education and Economic Development. Serving first in coaching youth at the “Chinatown YMCA Bubble” , Dr Guen served on the the South Cove Chinatown YMCA, the Chinatown Health Center, the Chinese Economic Development Council as well as the Tufts-CCBA Scholarship Committee.
He was among the first Chinese on the Boston Latin School Alumni Association, as well as the Fluoridation Committee of the Massachusetts Dental Society. He has been continuously active in his Tufts Dental School reunions as well as Boston Latin.
Dr Guen served three Mayoral Administrations with tenure on the (Treasurer) Board of Health and Hospitals, and the (Vice Chair) Boston School Committee. He formed the Boston-Taipei Sister City Relationship and led the Rededication of the Chinatown Archway, and traveled to Taiwan to source the proper tiles to Restore it to its present splendor. He initiated the community’s Double Ten Flag Raising Festivities on City Hall Plaza.
Dr Guen served on the Board of Lesley College, and is the Co-Founder of the Academy of the Pacific Rim Charter Public School, and still serves on its Foundation.
Continuing his passion for athletics as the Head Coach of the 63 year old Boston Knights Athletic Club’s Volleyball Program, he has brought the 77 year old North American Chinese Invitational Volleyball Tournament, the largest and continuous Asian sporting, historic and cultural event, twice to Boston, and once each to Ft Lauderdale, FL and Providence, RI. He currently is on its Board to help guide its growth in North America.
DR. YI ZHENG
Dr. Yi Zheng is a tenured professor with expertise in sustainable energy and clean technology in the Mechanical and Industrial Engineering Department, Director of Nano Energy Laboratory at Northeastern University (Boston, MA), ASME Fellow, and Founder of a cleantech startup Planck Energies. He serves as the Vice President of Asian Pacific Islander American Public Affairs (Greater Boston Chapter).
He received his Ph.D. and M.S. from Columbia University (New York, NY) and B.S. from the Tsinghua University (Beijing, China). Dr. Zheng has published over 90 peer-reviewed journal papers, filed 9 patents, and secured research grants over $4M from diverse sources including NSF, NIH, NASA, DARPA, ONR and Air Force. His current research aims to address climate change and the growing global challenges in energy and water scarcity. His achievements are reflected in some prestigious honors and awards including NASA Glenn Faculty Fellowship, ASTFE Early Career Researcher Award, NSF CAREER Award, NIH RI-INBRE Early Career Development Award, Soleeva Energy Innovation Award, Constantinos Mavroidis Translational Research Award, NECAA Year of the Scientist, President’s Volunteer Service Award, NSF Spirit of I-Corps Award, and MassVentures Acorn Innovation Award.
DR. MANJU SHETH
Dr. Manju Sheth has been a dedicated physician for over 25 years, with experience at Mass General Brigham, Beth Israel Lahey Health, and Harvard Vanguard/Atrius Health. A physician with a passion for media and community service, Dr. Manju Sheth is also the President of India New England Multimedia, where she created the prestigious New England Choice Awards, honoring prominent South Asian leaders in fields such as business, healthcare, nonprofit leadership, and technology.
She is known for her celebrity interview series Chai with Manju, which recently celebrated its 10 year anniversary and has received millions of views and featured esteemed guests including Indra Nooyi, Sadhguru, Elizabeth Warren, and Joe Kennedy to name a few. Her passion for empowering women is reflected in her work as the Director of Woman of the Year Award Gala for the past 12 years, and her previous work as Chair of the Advisory board of Saheli and with Asian Task Force [ATASK] over the years. She also serves as the Community Ambassador for Akshaya Patra USA, the world’s largest NGO serving mid-day meals in schools across India.
She strives to bring doctors together and advocate for healthcare, having been past president of the Indian Medical Association of New England [IMANE], served on the Patient Care Advisory Committee of Harvard Pilgrim Healthcare and through co-founding the New England Health Expo at India New England. She served on the steering committee for Diversity, Equity, and Inclusion at Harvard Vanguard/Atrius Health. She served as co-chair of Indian Women’s Physicians Forum.
Most recently, she co-founded Women Who Win, an award-winning nonprofit media platform amplifying the stories of diverse women, which recently published their first book. She has received numerous awards and recognitions for her work including 150 Women of Influence by YWCA and 50 most influential Indian Americans in New England. She resides in Lynnfield Massachusetts with her husband Dipak and has one daughter Shaleen.
LIEUTENANT GOVERNOR KIM DRISCOLL
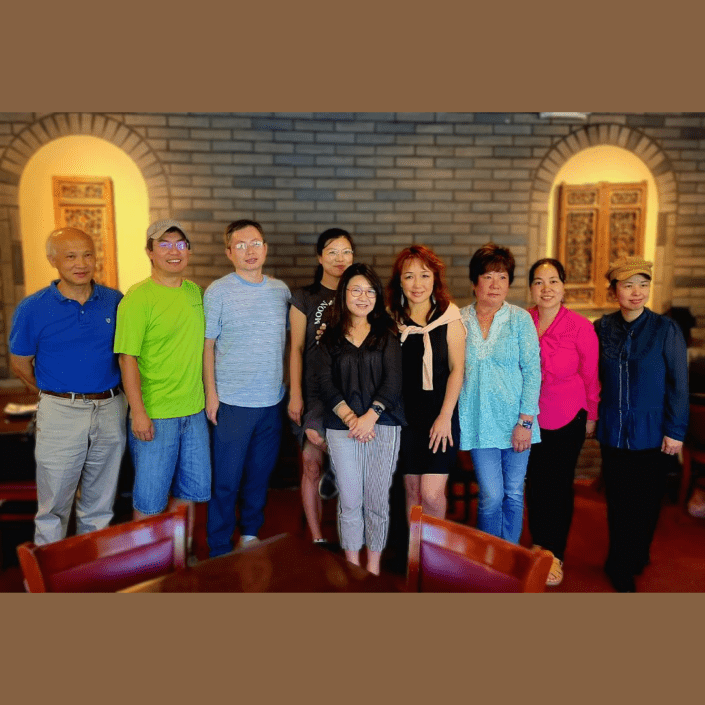
Established in 2013, the Chinese Association of Western Massachusetts (CAWM) is committed to enriching cultural diversity and fostering unity in western Mass. Our mission is to “connect communities through culture,” through diverse events, programs, and initiatives that promote cross-cultural exchange, dialogues, and celebration of heritage.
By partnering with local organizations, businesses, and educational institutions, CAWM contributes to the cultural landscape of Western Massachusetts, ensuring a sense of belonging for all residents. Whether through traditional festivals or educational workshops, CAWM provides an inclusive space for everyone to learn, explore, and grow.
To local Chinese American individuals and families, CAWM serves as a vital resource and support network, addressing unique challenges, promoting empowerment and well-being through advocacy, outreach, and services.
Led by passionate volunteers and supported by dedicated members, CAWM has thrived while promoting cross-cultural understanding and celebrating diversity. We will persist in our endeavor to build bridges of friendship and cooperation across Western Massachusetts and beyond.
PRALHAD KC
Pralhad KC is a certified international human rights consultant with over thirty years of specialized management experience. He brings a wealth of expertise in human rights, political affairs, international relations, law, and related fields. Mr. KC has effectively led numerous national and international economic development initiatives, overseeing diverse multinational teams. His skill set includes institutional capacity enhancement, strategic planning, program formulation and evaluation, training, and technical support.
He has played a pivotal role in a project aimed at promoting human rights awareness in collaboration with a prominent international organization, contributing significantly to the protection and promotion of human rights through targeted initiatives. Additionally, he has contributed to fostering a more inclusive and harmonious community environment within the immigrant community of the Commonwealth of Massachusetts.
His extensive track record includes leadership roles in projects conducted in partnership with prestigious entities such as the Asian Development Bank (ADB), the United Nations Development Program (UNDP), and local non-governmental organizations (NGOs). Furthermore, he has demonstrated proficiency in diagnosing challenges within the private sector and assisting public and semi-public institutions in implementing policy reforms to address these issues.
Rakashi follows in the footsteps of her grandfather, a community leader and advocate for the Indian community of Massachusetts. As a community leader, speaker and cultural advocate, Rakashi has organized numerous community focused and educational events to promote culture and advocate for Indians in America, create community connections, inspire our youth, and bring greater unity and strength to the Indian diaspora in New England. Rakashi has served as the President of the United India Association of New England, is a Trustee of the Jackson Homestead and Historic Newton, she is also a Human Rights Commissioner for the City of Newton and she serves on the Attorney General’s Immigrant Advisory Council.
Rakashi is the Reading Room Supervisor at the Massachusetts Historical Society where she guides scholars in their research, hosts school groups and curates exhibits. Established in 1791, the Massachusetts Historical Society is the nation’s first Historical Society and home to both local and national treasures including the Papers of John Adams and John Quincy Adams as well as Thomas Jefferson’s Private Papers. Ms. Chand’s areas of research include, the Influenza Pandemic of 1918 and parallel with the Covid19 Pandemic, and the historic connections between Asian cultures, communities and individuals with Massachusetts as illustrated through letters, diaries and artifacts housed in the collections of the Massachusetts Historical Society.
Emma Chen-Banas is a Fortune 100 Global Leader, NGO Leader, Entrepreneur, and TEDx Speaker. Currently, she serves as the United Nations Representative & Chief Administrative Officer at the Changier Education Foundation, an NGO with special consultative status with the UN Economic and Social Council. Additionally, Emma holds the position of Honorary Chairwoman of the American Chinese United Association Massachusetts Chapter, is a member of the Board of Trustees for Bement School (K-9), serves as a Corporator for Greenfield Savings Bank, and as co-founder for small businesses.
With a career spanning over 30 years in regional and global leadership roles, Emma has an extensive international background, she has lived and worked in North America, Asia Pacific, and Europe with esteemed organizations across various sectors, including healthcare, NGOs, technology, financial services, and manufacturing. Her international career is highlighted by key roles including Head of IT at GE Healthcare Southeast Asia in Singapore, Head of IT at Honeywell Europe, Middle East & Africa in London, and Assistant Vice President at MassMutual Financial Group. Emma has demonstrated strong expertise in leadership, strategy formulation, innovation, technology integration, lean methodologies, program/project oversight, strategic procurement, vendor relations, and operations management.
Since 2015, Emma has been dedicated to philanthropic endeavors, supporting various NGOs and advocating for the AAPI community while championing initiatives that foster cultural awareness and empowerment. She’s deeply committed to social justice and driven to create a more equitable society for local and at global platform, like UN. Additionally, during the pandemic, she voluntarily undertook the translation of a best-selling mental health self-help book from English to Chinese, demonstrating her commitment to spreading valuable information across languages and cultures. In recognition of her efforts, she was awarded the President’s Volunteer Service Lifetime
Achievement Award.
Emma holds an MBA from the University of South Australia and a Master of Science from Rensselaer Polytechnic Institute. As a sought-after speaker, she spoke at TEDx, global conferences like the American Society for Quality Global Innovation Conference and the Global Business Process Excellence Conference.
Yasmin Padamsee Forbes
Executive Director
Yasmin Padamsee Forbes is a dedicated advocate for change and community empowerment. As a first-generation student, immigrant, and single mother, she brings a unique perspective to her work, driven by her commitment to social justice, human rights, and sustainable development.
In her role as Executive Director of the Asian American and Pacific Islanders Commission in Massachusetts, Yasmin collaborates closely with commissioners and her team to foster a cooperative environment. Together, they have led the Commission to new achievements, including increasing its funding by 300%, introducing a strategic plan, expanding staff and intern programs, and founding the Commission’s Youth Council. Yasmin and her team have also organized and run listening sessions with Burmese, Tongan, Bhutanese, and Afghan communities, ensuring the Commission’s efforts have a meaningful and lasting impact on the communities it serves.
Yasmin has held senior leadership roles in non-profits and the United Nations across Papua New Guinea, India, Lao PDR, Myanmar, and the United States. Her extensive experience underscores the importance of cross-cultural collaboration and building strong partnerships for significant change. She holds a Master’s in Communications and Film Production from New York University, where she received a scholarship, and a Master’s in Public Administration from Harvard University.
Her impactful contributions have earned her notable recognition. Yasmin received the 2024 Community Diversity & Leadership Award from India New England News and the 2019 All-Star Award from the Harvard Kennedy School for her exceptional work in curating, fundraising, and organizing the LGBTQ film festival, “Pride and Progress.” Additionally, she was honored with the 2018 Julius E. Babbitt Memorial Volunteer Award from Harvard for her outstanding efforts in organizing and fostering partnerships with Harvard alumni in Myanmar. She also served as the Alumni Representative for Harvard University in Myanmar and was elected to the HKS Alumni Board of Directors from 2010-2014. Beyond her professional accomplishments, Yasmin is a Cambridge Human Rights Commission Commissioner. Committed to promoting diversity, equity, and inclusion, she works with communities to drive positive and sustainable change.
Sofia Hom
Youth Council Member
Sofia Hom thrives on learning which leads her to loving collaboration and exploring new ideas. She loves getting involved in school, clubs, and sports, and will always offer their help to anyone.
Will Hesp
Youth Council Member
Will Hesp (he/him) is a junior in high school who attends the Noble and Greenough School. He is of biracial descent as his mother was born in Japan, and his father was born in England. He draws inspiration from both of his ethnic backgrounds, which is what has led him to be interested in supporting every community that he is a part of. He has interests in various types of humanities, in addition passions for journalism, sports, and supporting the AAPI community. He is excited to join the AAPI Youth Council with goals such as promoting Asian marginalized groups.

Elliot Chung
Youth Council Member
Elliot is a first-generation Vietnamese-Cantonese American who grew up in Quincy, MA. They are devoted to being a youth voice in multiple non-profit organizations throughout the Greater Boston Area such as through my work with Artists For Humanity, CityMission Boston, and Boston Area Rape Crisis Center. They are committed to spreading equity and amplifying Asian-American voices in Massachusetts through working with the AAPI Commission Youth Council.
Ashley Shan
Youth Coordinator
Ashley Shan (she/her) is the Youth Coordinator of the AAPI Commission. She is a second-year student at Williams College, prospectively double majoring in American Studies and Comparative Literature, with a concentration in Asian American Studies. Ashley is committed to promoting marginalized voices, specifically for youth, previously serving as the Chair of the Dallas Youth Commission and working to generate a diverse, representative curriculum with school districts. She is particularly intrigued by the intersection of community organizing, artwork, and trauma and diaspora studies.
Ashley is excited to join the Commission staff team to continue advocating for AAPI residents across Massachusetts, focusing on elevating the diversity of the Commonwealth’s AAPI youth.
Place Holder For Content
Place Holder For Content
Place Holder For Content
Place Holder For Content
Place Holder For Content
Place Holder For Content
place Holder For Content
Place Holder For Content
Place Holder For Content
Place Holder For Content
Place Holder For Content
Place Holder For Content
Place Holder For Content
Place Holder For Content
Place Holder For Content
Place Holder For Content
Place Holder For Content
Place Holder For Content
Place Holder For Content
Place Holder For Content
Place Holder For Content
Place Holder For Content
Place Holder For Content
Place Holder For Content
Place Holder For Content
Place Holder For Content
Place Holder For Content
Place Holder For Content
Place Holder For Content
Place Holder For Content
Place Holder For Content
Place Holder For Conten
Place Holder For Content
Place Holder For Content
Place Holder For Content
Amy Zhou
Youth Council Member
Amy Zhou (she/her/hers) is currently a high schooler at Cambridge Rindge and Latin School and identifies as a queer, second-generation Chinese American. She is a lifelong Cambridge resident and has been participating in local activism for several years now. Amy is currently a commissioner on the Massachusetts Commission on LGBTQ+ Youth and a member of the Massachusetts GSA Student Leadership Council. When she’s not doing advocacy work, Amy is often reading, writing, or playing ultimate frisbee.
Amy has a deep passion for learning, especially history—there’s always something more to uncover and connect to the present day and future. She is dedicated to using history and education as tools for empathy, solidarity, empowerment, resistance, and liberation.
Ngan Huynh
Youth Council Member
Tasneem Ghadiali
Youth Council Member
Maggie Sun
Youth Council Member
Maggie (she/they) is currently a senior at Milton High School who hopes to major in Political Science. Maggie is passionate about boosting civic engagement and DEI initiatives in her community and will continue to as a member of the Youth Council. During her free time, she enjoys participating in debate tournaments, hanging out with animals, and playing video games.
Talvin Dhingra
Youth Council Member
Talvin Dhingra is a junior at Amherst Regional High School. As an Indian American, Talvin is very passionate about ethnic studies and racial justice. He is a former Stop AAPI Hate intern, a member of the Minority Student Achievement Network at ARHS, an active member of the People of Color United club at ARHS, and an active member of the AAPI club at ARHS. Talvin is committed to mandating ethnic studies across Massachusetts, and working to make Western Mass more accepting and accommodating towards Asians and Asian Americans. He is excited to join the Youth Council to expand on his work and to learn and grow as a student activist with peers that share the same goals.
Brissa Hunter
Pacific Islander Coordinator
Brissa Hunter (she/her), a passionate advocate for Pacific Islanders, leverages her unique background as an Indigenous Chamorro, Palauan, Yapese, and American woman and academic pursuits to serve as the Pacific Islander Coordinator for the AAPI Commission. Brissa is currently pursuing a Business Marketing degree at Simmons University. She comes from the sun-kissed shores of Saipan in the Northern Mariana Islands and brings a deep understanding of Pacific Islander experiences and challenges to the Commission. Driven by a desire to bridge cultural divides and advocate for her community and environmental causes, Brissa is excited to assist in building inclusive procedures and policies to make a significant impact on the AAPI Commission and the Pacific Islander community. In her free time, she enjoys swimming and snorkeling in Saipan’s pristine waters, watching films, and exploring Boston.
Ekta Srinivasa
Commissioner
Ms. Ekta Srinivasa was born in Nepal and immigrated to the U.S. when she was ten. She received her Bachelor of Science in Nursing from the University of Massachusetts Amherst and her Master of Science in Nursing from Curry College. She obtained her Nursing Ph.D. in Health Policy and Population Health at the University of Massachusetts, Boston. Ms. Srinivasa is the Founder of Improving Healthcare Culture, Inc. This nonprofit organization is established to provide resources to healthcare workers and healthcare organizations seeking strategies to mitigate the effects of workplace violence. Ms. Srinivasa is thrilled to be selected to serve in the Asian American and Pacific Islanders Commission. She hopes to contribute to the Commission’s goals meaningfully.
Philjay Solar
Commissioner
Philjay Somera Solar is currently a Privacy Officer at Mass General Hospital | Mass General Brigham protecting the health information privacy of state and federal HIPAA laws. Prior, he was an investigator at the U.S. Department of Health and Human Services, Office for Civil Rights. Philjay is also chair of the Commission’s Young Leadership Symposium. He received his Bachelor’s Degree in Criminal Justice from Lasell University (’13) and his Juris Doctor Degree from New England Law | Boston (’19). At New England Law, Philjay was President of the Asian Pacific American Law Student Association and the Executive Treasurer of the Student Bar Association.
Before attending law school, Philjay dedicated two years of public service with the AmeriCorps Program, City Year. Through City Year, he served the Boston Community working with a team of young individuals striving to close the education gap within inner city public schools.
Philjay has received numerous accolades most notably, being a 2018 Forbes 30 Under 30 Scholars Program recipient for Law and Government and a representative of the 2019 Filipino Youth Leadership Program (FYLPro) where he was picked by the Philippine Consulate of New York and Philippine Ambassador to the United States, Jose Romualdez.
He is also the founder of Fil-Lennials of New England which features young professionals of Filipino-American descent to inspire and connect other Filipino-Americans across New England. Philjay currently sits as President of the Philippine Dance and Culture Organization (PDCO), a Regional Advisor for the National Federation of Filipino Americans Association (NaFFAA) and Board Director for the Philippine American Mainstream Advocacy for Non-Partisan Associations, Inc. (PAMANA) Through PAMANA, Philjay has contributed to their annual Philippine Independence Day Celebrations and Filipino-American Highs School Leadership Workshop.
In his spare time, Philjay volunteers with multiple non-profit organizations like the Massachusetts Youth Leadership Foundation and BosFilipino. He is also an active liaison with the Philippine Consulate of New York where he communicates the needs of the Filipino-American Community in New England to the Consulate office.
Jennifer Rubin
Commissioner
Jennifer Rubin has practiced labor and employment law since her graduation from the UCLA School of Law. Ms. Rubin received both her B.A. and her J.D. from UCLA. She is a member of the State Bars of Massachusetts, California, and Washington, D.C. She is also a member of the bars of the United States Courts of Appeals for the D.C. Circuit, First Circuit, Second Circuit, Fifth Circuit, Sixth Circuit, and Ninth Circuit.
Ms. Rubin is the co-author of “Employment Discrimination Law” in “Employee and Union Member Guide to Labor Law: A Manual for Attorneys Representing the Labor Movement” (2008 and 2009 eds). Ms. Rubin has taught seminars, participated in panels, and led discussions on labor relations and contract negotiations. She also served as a judicial extern for federal District Judge Robert M. Takasugi of the United States District Court for the Central District of California. In 2014, Ms. Rubin was named a Massachusetts Super Lawyer Rising Star in Boston Magazine and has been listed in the Top Women Attorneys in Massachusetts in Boston Magazine for 2015 and 2016.
Before practicing in Massachusetts, Jennifer practiced at a firm in Washington, D.C., where she represented national and local labor unions in contract negotiations, litigation, hearings, and arbitrations.
In her free time, Ms. Rubin likes to write letters by hand and visit her local post office (she does not have a Facebook, Twitter, or Instagram account and refuses to give up her paper planner).
Bethany Li
Commissioner
Bethany Li has used a movement lawyering model to fight for social justice in Asian American communities and advance racial equity. Using an innovative and multi-faceted approach in collaboration with community organizers, Bethany has litigated cases and led advocacy work on a range of civil rights issues, including housing and displacement, workers’ rights, immigration, education equity, language access, and hate crimes. Bethany represented Southeast Asian communities fighting against deportation, including the first Cambodian American to return to the East Coast after deportation. In collaboration with community organizers, she co-produced the documentary “Keep Saray Home” about Southeast Asian families fighting deportations. She served as co-counsel to a multi-racial coalition of organizations and families intervening in a lawsuit in support of Boston Public Schools’ shift in exam policy. Bethany has won millions in back wages for low-wage workers along the Northeast corridor. She has led a variety of initiatives to increase low-income and limited- English proficient Asian Americans’ access to resources. She also published a report documenting the gentrification of Chinatowns on the East Coast and guided the launch of RAISE, the first undocumented Asian American youth group on the East Coast. Bethany started her legal career at AALDEF as an Equal Justice Works Fellow and staff attorney. She then taught and supervised cases in Yale Law School’s Veterans Legal Services Clinic as the Robert M. Cover Fellow. Bethany was also the Director of the Asian Outreach Unit at Greater Boston Legal Services. Bethany taught as an adjunct professor at Hunter College on Asian American civil rights and the law. Bethany graduated from Georgetown University Law Center and Amherst College. She serves on Massachusetts’ Supreme Judicial Court Standing Committee on Well Being and the Massachusetts Governor’s Task Force for Hate Crimes.
Danielle Kim
Commissioner
Danielle Kim is a proud second-generation Korean American, intersectional feminist, and community activist. She is the inaugural Executive Director of the Asian Community Fund at The Boston Foundation — the first and only philanthropic fund in Massachusetts dedicated to activating, convening, and supporting the Asian American and Pacific Islander (AAPI) community.
Danielle previously served as Director of Public Policy at the United Way of Massachusetts Bay, where she organized state and federal advocacy efforts, stewarded relationships with city and state lawmakers, and managed a portfolio of grantmaking. Prior to that, she was the Director of Communications at Scholars Strategy Network, where she shaped messaging, oversaw research and publications, and advanced data-driven policymaking. She also worked as the Director of Policy and Communications for Boston After School & Beyond, a city-wide coalition of after school and summer learning programs serving students in Boston Public Schools.
She began her career as a Fulbright Fellow in South Korea, and then served as a community organizer in her home state of New Jersey—most notably as a Regional Field Director for the 2012 presidential campaign. She continued on as a Communications Specialist in the New Jersey State Legislature, where she managed media relations for six state senators.
Danielle earned a Master’s degree in Education Policy and Management from the Harvard Graduate School of Education and a Bachelor’s degree in Government and Psychology from Smith College. Committed to expanding access to power and opportunity, Danielle serves on the Board of Directors for the Asian Community Development Corporation and the Chelsea Cultural Council.
Christopher Huang
Commissioner
Christopher Huang is a photographer and videographer with extensive experience in creating impactful visual narratives. He works with artists, public figures, leaders, companies, C-level executives, entrepreneurs, educators, politicians, performers, organizations, and students, among others, capturing their stories.
Christopher grew up knowing how frustrating and harmful it is to have Asian and Asian American stories told inaccurately, in a dehumanizing manner, by a media and entertainment industry that is white male dominated. Experiencing this developed his empathy for other marginalized and dehumanized people, and motivated him to tell these stories responsibly and accurately with a meticulous eye for detail. Those experiences have motivated him to continue creating cross-cultural bridges between communities.
Some of his career highlights include being hired to photograph some of the Asian American public media figures who helped inspire him to pursue a creative path. He is especially proud of inspiring younger POC storytellers to take control of their own narrative.
Christopher also gives keynotes and leads workshops on creating more empathetic and effective leadership with body language, both at the interpersonal and marketing level of the organization, promoting a culture that stresses equity, inclusion, and belonging. Even among those who do the basic step of talking about the importance of DEIB and show images with “diversity” in their organization’s branding, which is not as common as it should be, there is often a glaring disconnect in what they say and write compared to what they convey in body language.
His work can be seen at christopherhuang.com
Amy Goh
Commissioner
Amy Goh (she/her) is as a Certified Nurse-Midwife and PhD candidate. She is also Adjunct Faculty at Thomas Jefferson University’s Midwifery program. As a child of immigrants from South Korea, her decade long career as a midwife in the Boston area has focused on providing quality midwifery care for immigrant communities and communities of color. Most recently she received a grant to undertake an analysis of Asian American birth outcomes from the American Association of Birth Centers’ Perinatal Data Registry. Previous to her midwifery career, Amy worked to improve and better understand the complexities of health and rights in global communities. After her stint as a Peace Corps Volunteer in Cape Verde, she completed her MPhil thesis in International Development on the socio-political aspects of maternal mortality in Brazil. Amy is a Fellow of the American College of Nurse-Midwives and is on the Board of Directors of the American Association of Birth Centers. She was a former Health Equity Fellow through Cambridge Health Alliance’s Center for Health Equity Education and Advocacy and a previous Duke-Johnson and Johnson Nurse Leadership Fellow.
Richard T. Chu
Commissioner
Richard T. Chu was born and raised in the Philippines where he received his A.B. from Ateneo de Manila University, and completed his M.A. from Stanford University, and his Ph.D. from University of Southern California. His research and numerous publications focus on the history of the Chinese and Chinese mestizos in the Philippines and of the different Chinese diasporic communities in the world, centering on issues of race, ethnicity, gender, empire, and nationalism. He has also co-edited an anthology of LGBTQ studies pertaining to the Philippines.
He teaches courses on US empire and Philippine colonial history, as well as on the history of the Chinese diaspora and of Asian Americans. In 2018, he received the Community Hero Award from the Asian American Commission of the Commonwealth of Massachusetts for the work he has done in collaborating with Asian American communities in Western Massachusetts through the oral history project that his students conduct when taking his Asian American history course. In 2021, UMass Amherst conferred on him the Provost’s Distinguished Civic Engagement Teaching Award.
Moana Bentin
Commissioner
Moana Bentin is Senior Associate Director of Identity-Based alumni communities at the Massachusetts Institute of Technology. A proud Samoan tamaitai, she is an advocate for underserved and underrepresented communities. Her Cambridge home serves as a base for Pacific Island students studying in Greater Boston.
A descendant of the Seuamuli family in Fagamalo Savaii and Sa Aiono from Fasitoouta, Moana’s journey started from the village of Magiagi, through the University of the South Pacific in Suva, Fiji, and eventually settled in Cambridge, MA.
Moana is currently serving as Chair of the Board of Directors of the Cambridge Economic Opportunity Committee (CEOC) and Moderator of the Executive Council of First Church in Cambridge. She is the mother of two Samoan-Irish-Americans and human to two cats; Tama and Toa.